Environmental Action
How We Limit our Environmental Impact

We take measurable actions to ensure we are achieving our mission and growing as sustainably as possible.

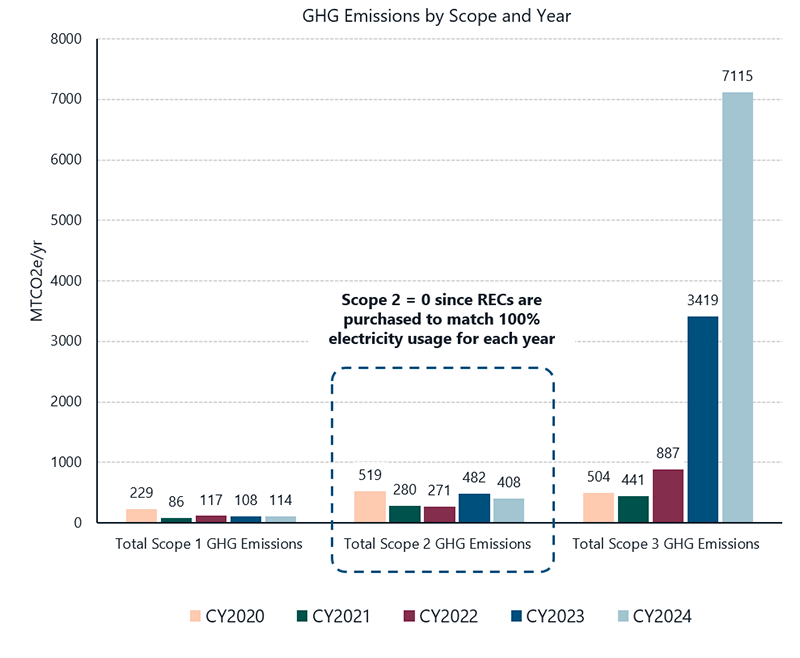
Cadmus has been tracking and reporting its greenhouse gas (GHG) emissions since 2016. Over the years several notable changes have affected our GHG emissions:​

  • Cadmus’ acquisition of ifok and Meister Consultants Group in 2017, and the acquisition of Wheelhouse Group in 2022.​
  • The onset of COVID-19 in 2019, and the resulting pandemic, which led to employees working from home and remotely rather than in our offices.​
  • Employees continuing to work from home or remotely, while some staff returned to in-office work.​

Cadmus Scope 1, 2, and 3 Emissions: CY2020-CY2022

  • In 2022, Cadmus’ Scope 1 and 2 emissions were 388 MTCO2e. ​
  • Cadmus purchases renewable energy certificates (RECs) equivalent to 100% of our electricity usage making Scope 2 emissions ZERO. Total Scope 1 and 2 emissions remain at 117 MTCO2e.​
  • During 2020-2022, our Scope 1 emissions declined significantly. As employees worked from home, natural gas used for heating offices, and gasoline use from vehicles at Cadmus’ European offices declined. ​
  • Scope 3 emissions, which are indirect emissions from our supply chain of goods and services purchased by Cadmus, increased during this time period. This was a result of Cadmus’ revenue and staff increasing substantially over the past two years.

Cadmus Scope 1 and 2 Emissions by Source CY2022

  • Nearly two-thirds of Cadmus’ total emissions would be from its electricity consumption, which is calculated based on the fossil fuel mix of the grid in each region that Cadmus’ offices are located.​
  • However, Cadmus purchases RECs equivalent to 100% of its electricity usage, which results in our actual Scope 2 purchased electricity emissions to be ZERO.
  • Of the remaining Scope 1 emissions, about one-quarter are from natural gas used for space heating in offices.​
  • The remaining 5% of Scope 1 emissions are from gasoline vehicles used in Cadmus’ European offices.​ We are planning to replace these with electric vehicles over time.

Pie Chart Data – Scope 1 and 2 Emissions by Source
Purchased Electricity 70%
Stationary Combustion 25%
Mobile Combustion 5%

Cadmus Scope 3 Emissions CY2022

  • In 2022, Cadmus’ total Scope 3 emissions were 887 MTCO2e.​
  • The largest percentage of Cadmus’ Scope 3 emissions come from employee commuting, followed by purchased capital goods (e.g. computers), business travel, and other purchased goods and services (e.g. software, and other professional services). ​
  • A small amount of Scope 3 emissions are from T&D losses from purchased electricity used.

Pie Chart Data – Scope 3 Emissions​
Employee Commute 36%
Capital Goods 31%
Business Travel 26%
Purchased Goods and Services 6%
T&D Losses 1%