A key challenge in electrifying trucks, buses, and other medium-, heavy-duty (MDHD) vehicles and equipment is the long lead time involved in upgrading the electrical distribution system. Site development timelines often exceed two or three years, eroding public support and sometimes adding unintended costs. Governments are increasingly enacting rules around activation timelines, like the 2024 decision by the California Public Utility Commission to cap energization timelines.[1] Larger MDHD sites are more complex to design and permit than smaller sites and often require extensive infrastructure upgrades. The procurement time of certain equipment, such as switchgear, can be anywhere from 40 to 70 weeks.
[1] D.24-09-020 Decision Establishing Target Energization Time Periods and Procedure for Customers to Report Energization Delays
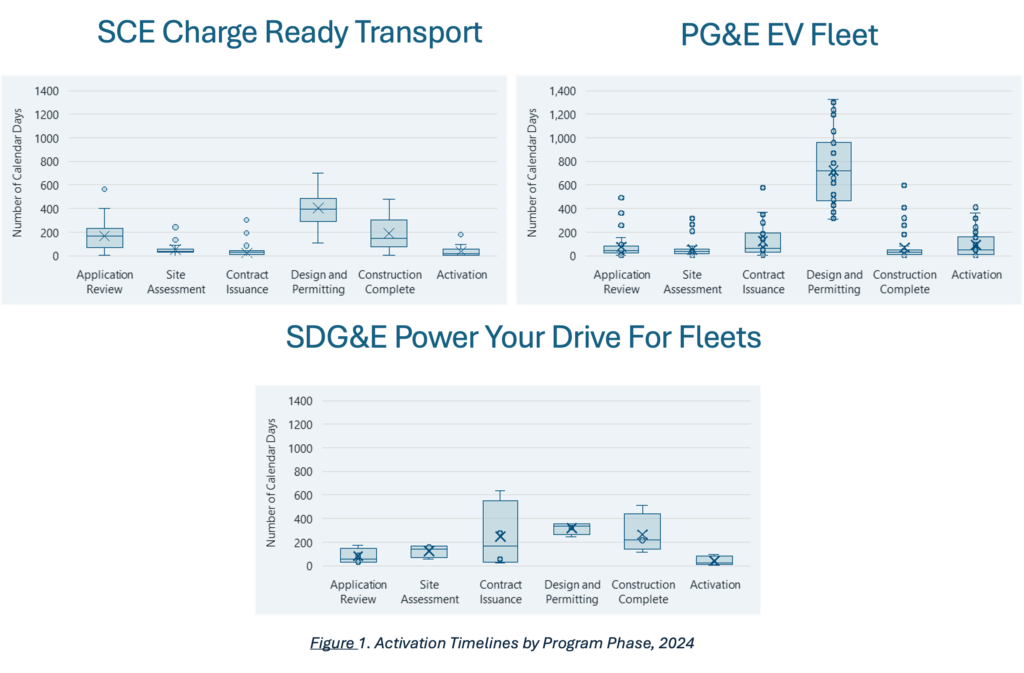
Our latest evaluation report of utility-led charging programs includes over 200 MDHD charging sites, allowing us to examine drivers of site activation timelines. Sites in the evaluation average 16 ports and 750 kW per site. Each site follows a standard development sequence 1) application to participate in utility program, 2) site assessment, 3) contract issuance, 4) design and permitting, 5) construction complete, and 6) activation.
The median start to finish time for our latest year of data was 983 calendar days, or 32 months. This timeline accounts for the duration of when the site developer originally applies to a utility incentive program to when the chargers are activated. When the utility programs were first initiated in 2021, utility estimated projects would take just 11 to 19 months to complete – about half the time it look in 2024.
As shown in the box and whisker graphs below, the long lead times are heavily attributable to the design and permitting phase, with a median of 491 days across all 200+ sites, or over 50% of the total median days to activation (Figure 1). The design and permitting phase length is driven by several factors, including long lead times for procurement of equipment, changes to project design and delays in permitting approvals from local authorities having jurisdiction.
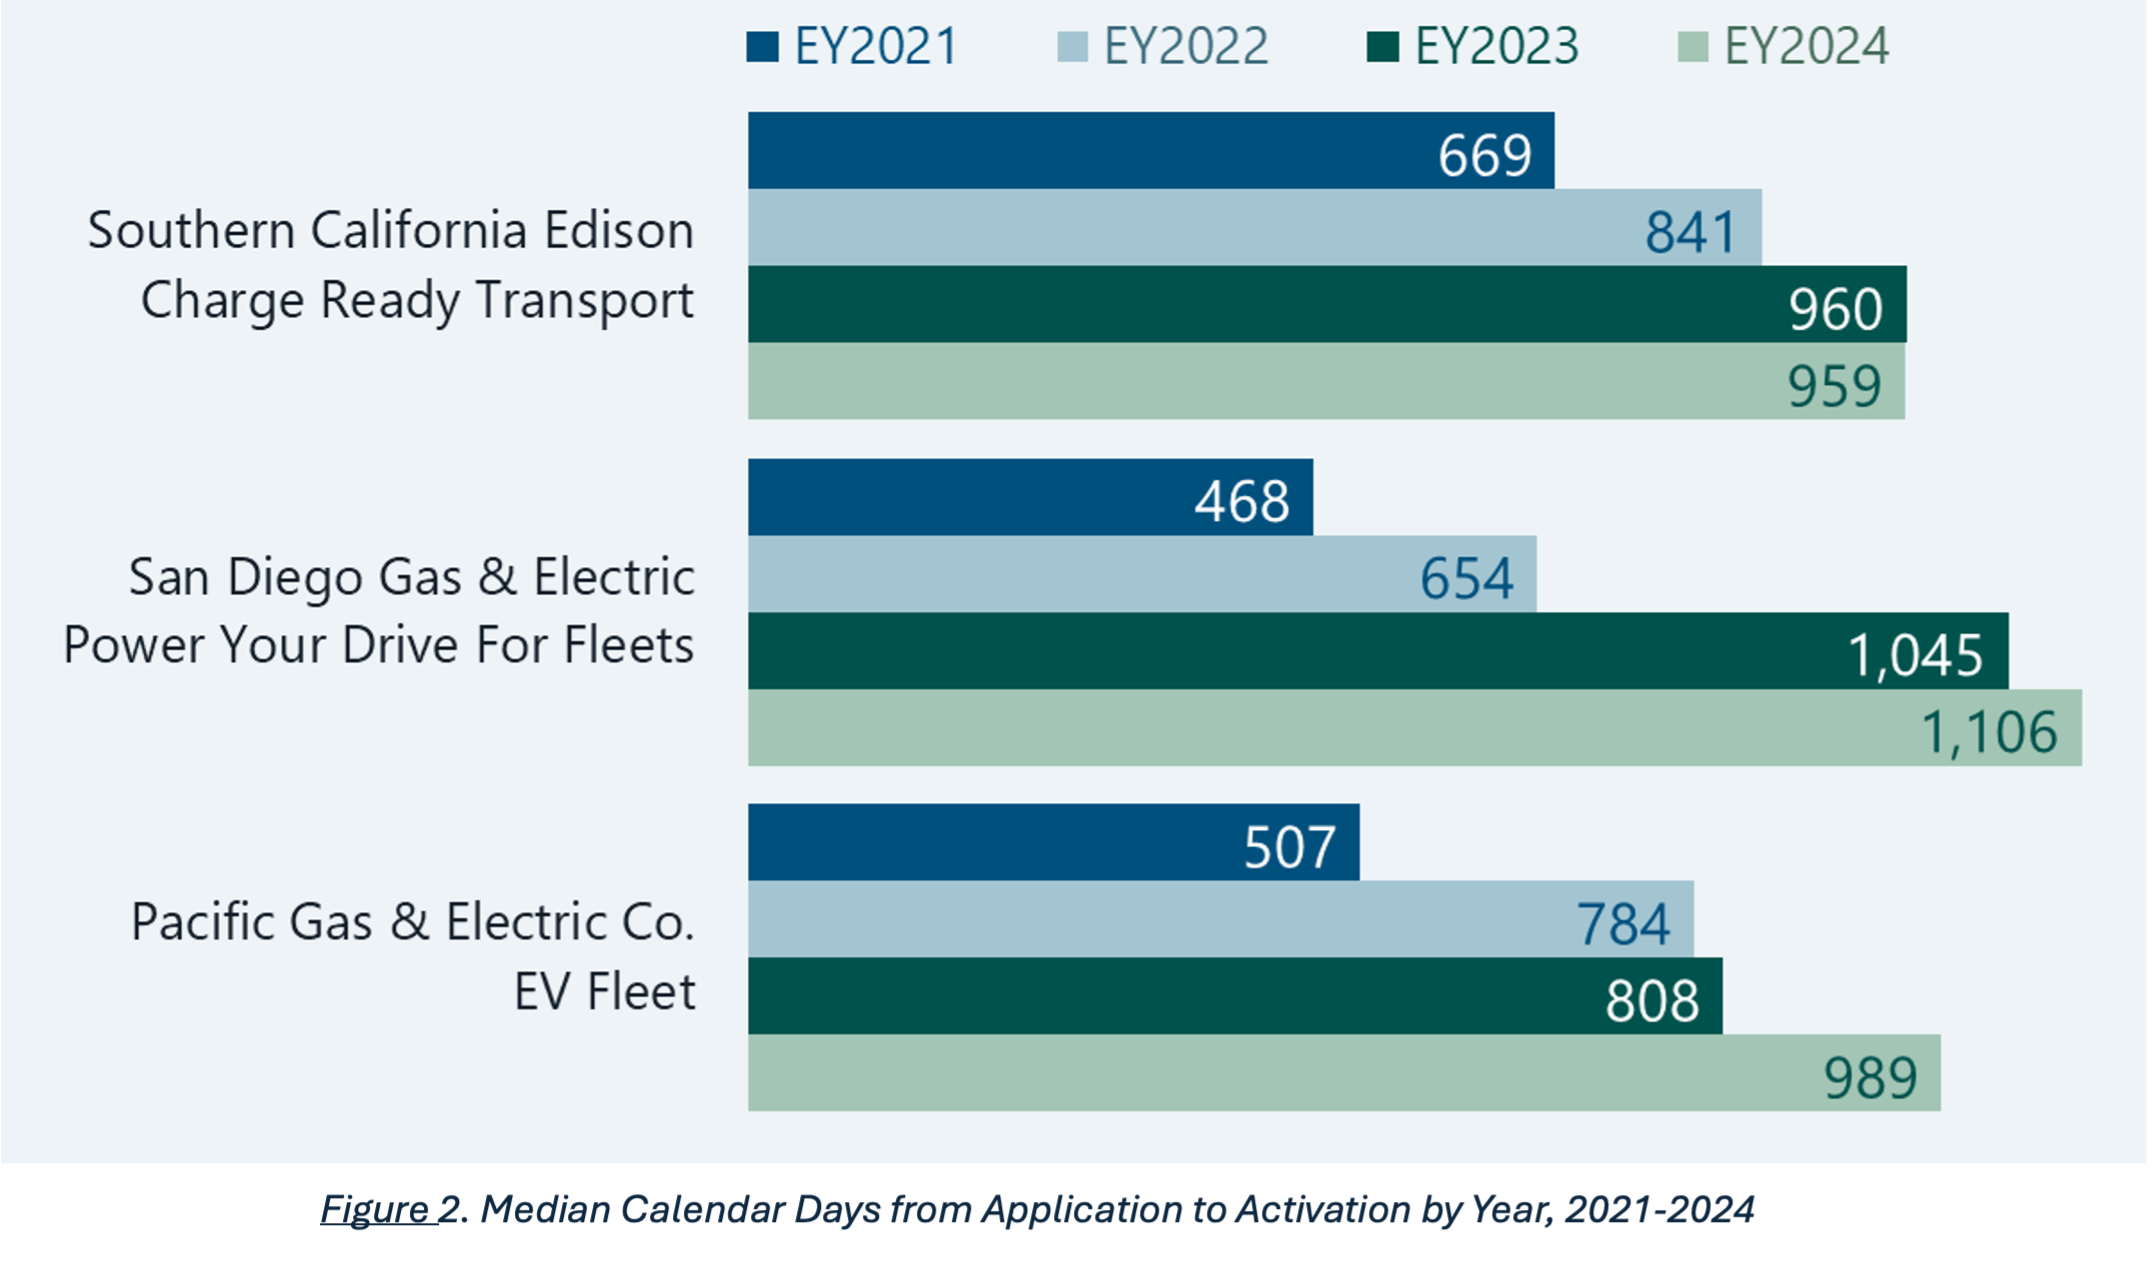
We found projects are also taking much longer to complete year over year (Figure 2). Across all utility MDHD programs, sites had a median start-to-finish timeline of 600 days in 2021, 725 days in 2022, 862 days in 2023 and 983 days in 2024. It is important to note that larger, more complex sites have longer activation timelines all else equal and this trend of growing site development durations could be due to the utilities activating larger sites in later years.
 Background
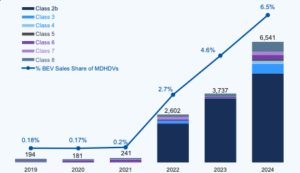
 Each year, about 100,000 new Class 2b-8 vehicles are sold in California. MDHD electric vehicle (EV) sales took off in 2022, corresponding with the rise of Class 2b EVs like the Rivian R1T, Rivian R1S, and Ford F-150 Lightning. Fast forward to 2024 and you see a continued rise across all vehicle classes, but especially Class 3-8. Overall, the state saw a 6.5% EV sales share among Class 2b-8 in 2024.
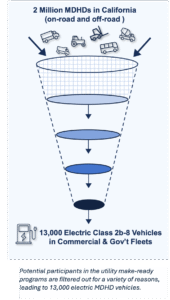
Is the 13,000 cumulative MDHD EV sales a success for the Golden State? When you look back at goals set 5+ years ago, fleets in the state are behind. In 2018-2019, a goal was set for three major utility programs to provide make-ready infrastructure for 1,800+ sites by 2026. As a result of supply chain issues, COVID and other factors, the California Public Utilities Commission (CPUC) has since revised the site goal down to a total 1,175, which still may not be achieved – though some individual utilities are on pace to meet targets.
This begs the question: what’s hindering EV adoption among MDHD fleets? Here are a few reasons we explore in our latest Evaluation Report:
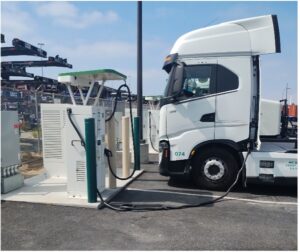
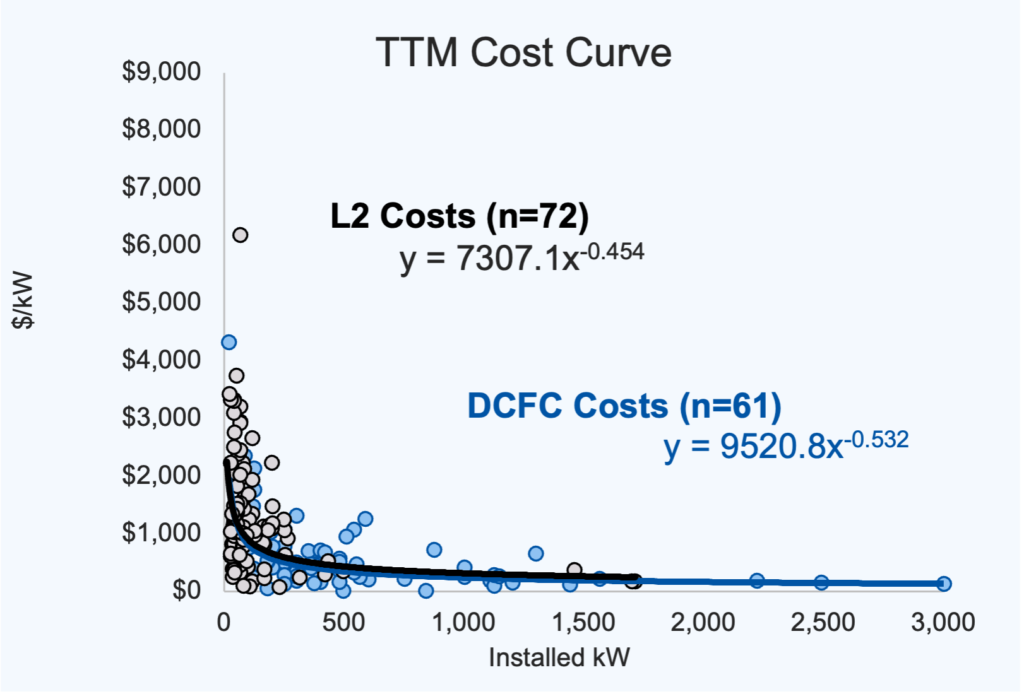
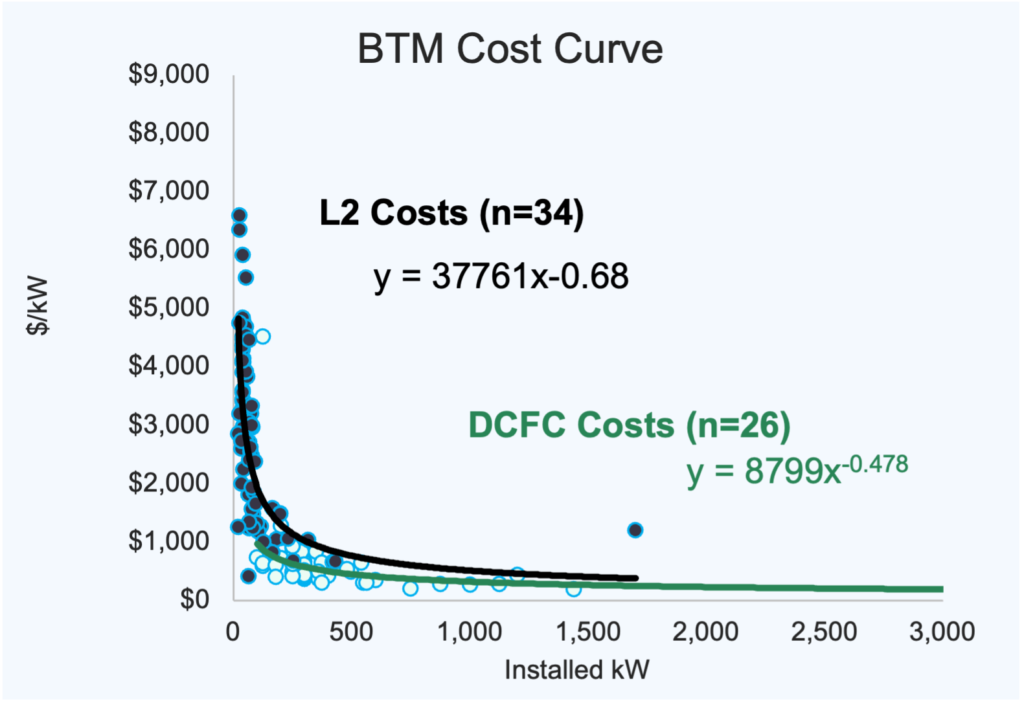
Electric trucks and buses are rolling out across the U.S.—from rural package delivery hubs to busy urban transit depots. However, few reliable sources assess the costs of installing the charging infrastructure for these fleets—costs that are born by either the electric utility, site host, and/or fleet. That’s where our work comes in.
Cadmus and Energetics lead the largest 3rd-party evaluation in the country of medium- and heavy-duty electric vehicle charging—an evaluation that encompasses over 60% of California’s Class 3 to 8 electric vehicles as of the end of 2024.
In our latest report, we analyzed data from 150 MDHD charging sites across California. These sites vary widely in size, location, and vehicle type. Here are some key takeaways: